Analysing a cross-channel fundraising campaign can sometimes feel like trying to solve a Rubik’s Cube blindfolded. You’ve got data pouring in from all directions – paid search, paid social, organic traffic, emails, display ads, each living in its own dashboard silo. For many charities (especially smaller ones), making sense of all this information to figure out what’s really driving donations is a major headache.
Here we look at three big challenges charities face with cross-channel campaign analysis and, importantly, how to overcome them:
- Insufficient data – the small charity dilemma
- Biased reporting – Media agencies “marking their own homework”
- Data overload and analysis paralysis – too much of a good thing
Challenge 1: Insufficient data – the small charity dilemma
Small and mid-sized charities often struggle with having too few data points to analyse. With low conversion volumes (e.g. only a handful of online donations or sign-ups each month), every metric can swing wildly. One week, your Facebook ad brings in three donations, the next week, zero. Does that mean it “stopped working,” or is it just randomness?
Low volumes make it hard to tell.
Advanced attribution models or fancy tools like Google’s data-driven attribution or econometric marketing mix modelling (MMM) often simply don’t work for organisations without large datasets. These methods need a lot of data to produce reliable insights. Some would argue that MMM is only really suitable for the top 1% of charities with years of data and hundreds of consistent observations to feed the models.
In other words, most small charities just don’t have the luxury of “big data,” and that can leave them flying somewhat blind when trying to attribute results across channels.
Low data volumes also mean statistical significance is hard to come by. A/B testing a new donation page? If only 20 people donate per month, it could take a long time to detect a meaningful difference between variants. Month-to-month performance might fluctuate due to sheer chance. It’s like trying to identify a trend from a couple of raindrops. No wonder many charity fundraisers feel unsure about drawing conclusions from their scant Google Analytics or CRM data.

What do I do when data volumes are insufficient for A/B testing?
When you’re dealing with small numbers, you need to maximise the insight from the data you do have and adjust your approach to analysis:
- Aggregate and extend time frames: Instead of evaluating channel performance on a weekly basis (which can be noisy), consider analysing a quarter or even a year of combined data. Aggregating data over a longer period can reveal patterns that aren’t visible on a week-to-week basis. For example, one small youth charity found that while monthly online donations were tiny, aggregating a full year showed that 60% of donors had come via an email campaign versus 30% via social, a useful insight to guide strategy.
- Focus on leading indicators: If final donations are too few to analyse, look at upstream metrics that occur more frequently – i.e. move your focus higher UP the funnel. For example, users who viewed more than 50% of the appeal story page or clicked the donate button and viewed step 1 of the donation form – these “micro-conversions” can act as proxies for engagement. They happen in greater numbers, giving you more to work with. For instance, if only 5 people registered for your fundraiser but 200 clicked the registration link, that click data (by channel, audience, etc.) can hint at where interest was highest. It’s not as good as donation data, but it’s better than nothing and can inform your next move.
- Use benchmarks and industry insights: Compare your performance to nonprofit benchmarks or similar organisations (where available) to get context. If your conversion rate is 2% but typical charity campaigns see 5%, you know there’s room to improve. Benchmarks must be taken with a grain of salt, but they can help set expectations when your own data is sparse.
- Don’t over-complicate attribution models: With limited data, stick to simple, easy-to-explain attribution (like using last-click or first-click consistently) rather than splitting hairs with multi-touch models that likely won’t be statistically robust for you. You can still manually consider other touchpoints qualitatively. For example, if one donor gave after seeing a Facebook post and later a Google Ad, you might recognise both played a role, even if your reporting tool gives 100% credit to the last click. The key is to avoid placing too much trust in any single model’s numbers when volumes are low. Remember that data-driven attribution algorithms themselves need sufficient volume to be meaningful – Google’s own data-driven model usually requires lots of data before it makes sense. If you don’t have that, a simpler model plus human interpretation is safer. Just remember to approach things with a slightly cynical frame of mind – if Facebook’s pixel is reporting 200 conversions (using post-view and click) but Google Analytics tells you there’s only 100 conversion from your Facebook ads (using last-click) then the truth about the impact of your Facebook investment is likely somewhere in the middle of the two datasets.
- Combine channels where possible: Instead of viewing each channel in isolation, consider grouping some data to reach critical mass. Perhaps you can evaluate “social media overall” vs “search overall” contributions, rather than splitting into dozens of micro-campaigns. Pooling data can sometimes reveal a signal where each slice was too thin alone. Just be careful to group logically (e.g. group similar channels or campaigns with the same goal).
By adjusting your lens in these ways, even a small charity can extract actionable insights. One insider tip: if you’re unsure whether a change in performance is real or just a random fluctuation (which is common with low counts), you can use simple statistical tools (even an online significance calculator) to check. If that sounds too technical, this is exactly where a quick expert audit can help. An experienced analyst can review your data and tell you what’s noise and what’s signal, saving you from chasing shadows.
I need some dashboard help
Get in touch with a Ninja for a no obligation review of your existing dashboards.
Challenge 2: Media agencies “marking their own homework” – biased reporting
Many charities partner with media agencies or external vendors to run specific channels – perhaps an agency manages your Google Ads (ahem, if not we know a good one who can help 😉), another handles Facebook, etc. These agencies usually provide performance reports to show how great your campaigns are doing. But here’s the catch: can you fully trust a vendor to grade their own work? There’s an inherent conflict of interest.
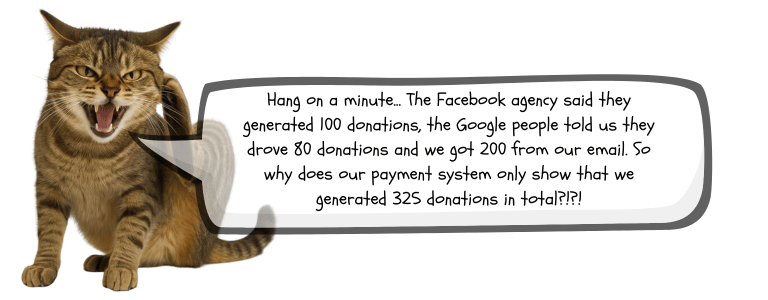
Some agencies (certainly not all) may be inclined to present results in the best possible light, potentially cherry-picking metrics or attribution models that inflate their contribution. As one charity CEO wryly noted, “If I added up all the donations each of our agencies claimed credit for, I’d have twice as many donations and could retire”. In other words, each channel’s report was crediting itself for the same donations, leading to double-counting across reports. It’s easy to see how this happens: if your Google Ads agency uses last-click attribution, they’ll count a donation if the donor’s final click was on a Google Ad.
Meanwhile, your social agency might be counting that same donor because she originally clicked a Facebook ad last week. Both reports say “we drove this donation!” – technically true in each narrow view, but not in aggregate.
This challenge is often summed up as agencies “marking their own homework.” You get a report card from the very people who did the work. Even with the best intentions, it can be hard for them to be impartial.
Last-touch attribution, in particular, tends to overstate the impact of certain channels (paid search is a common culprit), and agencies might not be quick to inform you that a portion of their conversions would have occurred anyway or via another channel. The result can be overly rosy reports that don’t quite match reality. For a charity trying to understand cross-channel performance, this is a big hurdle – you lack a single version of the truth. There’s a risk of inefficient budget allocation (because every channel looks like a hero in isolation), and internally it breeds mistrust (“are these results real?”). In the worst cases, charity teams feel they have the wool pulled over their eyes by complex agency dashboards full of metrics that always trend up and to the right.
First and foremost, take back control of your data and narrative. This doesn’t mean doing everything in-house, but it does mean setting up checks and balances:
- Insist on transparency and access: Make sure you have direct access to the raw data for your campaigns – whether that’s Google Analytics, ad platform dashboards, or your CRM donation records. If an agency report says “we got 50 donations”, you should be able to verify those 50 in your own systems. Own your Google Ads and Facebook Ads accounts (adding agencies as users rather than letting them run things in their black box accounts) so that you can log in any time and see the real numbers. When agencies know you can verify their homework, they’re more likely to play it straight.
- Implement a unified reporting framework: Instead of relying solely on separate reports from each channel, consolidate the data into one holistic dashboard or report that you control (or that a neutral party creates for you). For example, set up a simple spreadsheet or business intelligence dashboard where you input or pull in key metrics from all sources and compare side by side. This way, you’ll quickly notice if the sum of channel-specific conversions exceeds your actual total conversions (a red flag). Having everything in one place also forces a consistent attribution logic. You might choose to use Google Analytics’ cross-channel data as the source of truth for conversions and then see how each channel contributed. It’s harder for biases to hide in a unified view.
Help me consolidate my digital dashboards
The Ninjas are ready and waiting to help you consolidate and improve your digital fundraising reporting.
- Use independent attribution or audits: If budget allows and the stakes are high, consider an independent analysis of your cross-channel performance. This could be an attribution audit by a third party or using a neutral tool to double-check what portion of donations each channel truly drives. For instance, marketing mix modelling (MMM) – when feasible – can provide an objective view by analysing spend and results over time across all channels (though remember MMM isn’t magic and not suited to very low data scenarios). Even a simpler approach, like looking at incremental lift (turning channels on/off and measuring the difference) can help validate agency-reported results. The key is that an outside perspective can catch if an agency is over-claiming credit. As marketing commentators have pointed out, it’s good “ethical hygiene” to avoid any perception that results are biased; working with an independent party or tool for measurement can ensure your agencies aren’t grading themselves unfairly.
- Foster a collaborative (not adversarial) relationship: Share your intention to verify and unify data in a positive way. The goal isn’t to play “gotcha” with agencies, but to align on the same metrics of success. Encourage open conversations: for example, discuss attribution openly – “We know last-click can be misleading, how about we all agree to look at multi-touch or assisted conversions as well?” A good agency will appreciate a savvy client and should be willing to help you get that single source of truth. If an agency is truly resistant to transparency, consider it a warning sign. Most reputable agencies today understand the need for clarity and will work with you on independent reporting if asked.
- Regularly cross-check with internal data: Finally, always sanity-check channel performance against your internal figures. If your CRM shows 100 total donations last month and the sum of what all channels claim is 180, you know something’s off. Investigate discrepancies, often it’s attribution overlaps or tracking issues. By reconciling to real outcomes (like banked donations or new donor counts), you keep everyone honest.
In short, be the teacher marking the exams, or at least oversee the process. It’s fine to let experts run the campaigns, but when it comes to reporting, make sure all parties are singing from the same songbook. This protects your charity from misallocating funds based on overhyped results and gives you confidence about what’s truly working. And if it still feels daunting, a neutral expert can act as an umpire, reviewing agency performance on your behalf and providing an unbiased verdict.
Need a data umprire?
Let us help you make the call on what data matters most – and what can wait.
Challenge 3: Data overload and analysis paralysis – too much of a good thing
At the opposite end of the spectrum from having not enough data is having so much data that you don’t know where to start. For larger charities or even small ones using multiple digital tools, it’s easy to become overwhelmed by numbers. Each channel offers a firehose of metrics and reports: Google Analytics alone has dozens of reports; Facebook Ads Manager, Google Ads, email platforms, etc. all have their own dashboards. Soon, you have data coming out of your ears – and possibly a weekly reporting deck thicker than War and Peace. Many nonprofits pride themselves on being “data-driven,” but in practice, staff can end up drowning in data with no lifeboat of insight in sight. In fact, a recent survey found nearly half of charities say their biggest challenge is using data to inform decision-making and strategy. They have the data; making sense of it is another matter.
Classic symptoms of this overload include: spending hours (or days) every month pulling reports from various platforms, only to end up with a 50-page document that few people actually act on; an ever-growing list of KPIs because someone keeps saying “can we track this as well?”; and the dreaded analysis paralysis, where the sheer volume of numbers causes decision-making to grind to a halt. Important signals get lost in a sea of charts.
As one fundraising analyst quipped, “We had so many graphs in our dashboard that we needed a dashboard just to navigate the dashboard.” It’s not just anecdotal – studies note that too many metrics can be detrimental: key insights get lost in the noise, and teams may become overwhelmed and confused, ultimately disengaging from the data. In the worst case, a charity might oscillate between strategies or fail to act at all because every number tells a slightly different story and it’s unclear which to believe or prioritise.
To make matters worse, data overload is often exacerbated by the use of disparate systems. When your information lives in silos, it’s tough to get a unified view. You might have web analytics in one tool, email stats in another, and donation data in a CRM, all disconnected.
This fragmentation makes it easy to lose track of vital data points and overlook something important. If your dashboards are also slow or clunky (we’re looking at you, legacy CRM reporting modules and sometimes even Google’s Looker Studio when it’s having a bad day and connected only directly via Ads APIs – hint: consider a data warehouse), the effort required to wrangle the data multiplies. It’s not uncommon for internal teams (often wearing multiple hats already) to simply not have the time or specialised skills to keep wrangling and interpreting heaps of data. The result? Either analysis doesn’t happen at the depth needed, or it happens and no one has the bandwidth to digest it all.
The antidote to data overload is focus and simplification, with a healthy dose of smart data management:
- Define your North Star metrics: Step back and ask, what are the few key metrics that truly measure success for our fundraising campaign? Likely answers: number of donations, total revenue, cost per acquisition, maybe donor retention rate or average gift size. Start with 2-3 primary KPIs that map to your goals. These are the figures you’ll obsess over. Everything else is secondary or diagnostic. By narrowing your focus, you immediately cut through a lot of noise. As the old adage goes, “measure what matters.” If a metric isn’t clearly linked to a strategic objective, consider removing it from your main dashboard (it can be included in the appendix as needed). Many experts suggest keeping the number of metrics on a dashboard limited – ten or fewer is a good rule of thumb. For example, your core campaign dashboard might show: visits, conversion rate, donations, revenue, and cost per donation by channel – and that’s it. Keep it tight.
- Establish a clear hierarchy of reports: Not all data is for everyone at all times. You might create a simple weekly snapshot for leadership that highlights just key outcomes and any red/flashing alerts (“donations down 20% this week, investigate!”). Then, have a more detailed monthly report for the digital team that includes deeper diagnostics (such as breakdowns by channel, device, etc.). However, even that should be structured and not just a data dump. By layering your reporting (summary vs. detailed), you ensure the right people see the right amount of data. This prevents folks from getting lost in details they don’t need and keeps focus on actionable insight.
- Unify and integrate data sources: It’s worth investing time (or getting help) to connect your disparate data into one system or at least one combined view. Whether it’s a CRM that ingests web analytics and email data, or a business intelligence tool (like Google Looker Studio, Tableau, etc.) that you feed all your channel data into – having a single view drastically reduces the mental load. Instead of logging into five platforms, you go to one dashboard that shows cross-channel performance holistically. Many charities still struggle with siloed data, which is why moving toward a unified data solution (even if it’s scrappy, like CSV exports combined in Excel) will save you headaches and ensure nothing vital slips through the cracks.
Bonus: once set up, an integrated dashboard can be refreshed with a click, freeing you from manually cobbling reports together each time. - Prioritise actionable insights: Make it a practice to highlight insights, not just numbers. For every report, ask “So what? What should we do about this?” If a metric isn’t actionable, maybe you don’t need to obsess over it regularly. For example, tracking the exact number of TikTok or Instagram impressions monthly might not be actionable for fundraising – a trend of engagement rate might be more useful if social is mainly for awareness. By focusing on actionable data, you naturally trim the excess. Some charities literally add a one-page “Insights & Actions” summary to the front of their reports, listing key learnings and planned actions, to ensure that all that data translates into decisions.
- Improve data literacy and culture: Sometimes, overload is exacerbated by uncertainty – team members aren’t sure how to interpret the data, so they keep including everything “just in case.” Investing in a bit of training (or bringing in an expert for a workshop) can empower your team to know what to look for. When people feel confident in reading the data, they’re more willing to simplify and trust a smaller set of metrics. Cultivate a culture where it’s okay to not track everything under the sun – instead, you track what drives your strategy.
- Speed up and automate where possible: If dashboards are slow or manual, fix that if you can. Nothing causes burnout like spending half your week waiting for reports to load or doing repetitive tasks like copy-pasting. Simplifying metrics helps here (fewer queries = faster dashboards). You can also explore tools or scripts to pull data automatically. Even using Google Analytics’ API or Supermetrics into a Google Sheet can automate a lot of reporting grunt work. The less time spent gathering data, the more time you have to analyse and act on it. And if a particular platform’s dashboard is truly awful, export the raw data and do your analysis elsewhere – don’t torture yourself with spinning load wheels.
By streamlining your approach, you transform data from a burden into a genuine asset. One charity, for example, went from a 30-page monthly report that nobody had time to absorb, to a lean 5-page dashboard with commentary.
They joked that it felt like losing weight – only the good data calories remained. Decisions became easier and faster because the team wasn’t stuck in analysis paralysis. Remember: data is a means to an end, not an end in itself. Aim for actionable clarity over sheer quantity. If you ever find yourself adding “just one more metric” to a report, pause and consider which existing metric could perhaps be removed or replaced. And if you’re really stuck, there’s no shame in calling in reinforcements – ahem, Digital Ninjas anyone 😉!?
Sometimes an external perspective can identify which metrics truly matter to your goals and help build a dashboard that surfaces those, hiding the less useful noise.
From Chaos to Clarity
Cross-channel campaign analysis for fundraising is undeniably challenging, but this challenge is not insurmountable. Whether you’re grappling with too little data to crunch, too many glowing reports from agencies, or simply too much data overall, there are practical ways forward. The common thread is to be proactive and intentional with your approach: collect the right data (even if it’s small), verify and consolidate information for truth, and focus on insights over volume.
Charities that master these challenges often find they can punch above their weight in digital fundraising. When you truly understand what’s driving performance, you can allocate your precious budget and time more effectively – doubling down on what works, fixing or cutting what doesn’t. Instead of dreading monthly reporting or attributing success by guesswork, you gain confidence in explaining to your team, leadership, and trustees exactly how each channel contributes to your mission’s bottom line.
And remember, you’re not alone on this journey. Many digital fundraisers share the same headaches, and there’s a growing community (and industry) of support. Whether it’s adopting a smarter dashboard, getting an independent audit of your campaigns, or even partnering with folks like Digital Ninjas for ongoing performance support, help is available. The goal isn’t to turn every charity worker into a data scientist, but to remove the friction so that even a small team can get big-picture insights.
Think of your cross-channel data like a good cup of tea. Too weak (not enough data) or too strong (overwhelming data) can both be unpalatable – Yorkshire Tea the perfect combo? The trick is to get the brew just right – a balanced blend that gives you warmth, clarity, and the energy to move forward. With the challenges and solutions we’ve discussed, you’ll be well on your way to brewing that perfect insight. Happy fundraising, and here’s to turning data from a pain into a partner for your cause!
Yes, I'd like a Yorkshire Tea flavoured dashboard please
The Ninjas will brew your perfect dashboard- with a perfect blend of cross channel reporting, clear KPIs and useful insights to help you grow your campaign performance.