
Whether you’re an online business that sells virtual products or a bricks and mortar store taking its first step online, you must track and measure everything you do digitally from day one.
Tracking and measuring different parts of your online presence gives you invaluable data to make better business decisions.
Better decisions lead to better results.
With more online metrics to track than you can shake a stick at, in today’s article I’m going to reveal 5 stats you must continually monitor in Google Analytics along with a few tips and how you can improve them.
1. Bounce rate
Bounce rate is a percentage measurement of the number of people who visit your website and leave without reading any subsequent pages. There are two types of bouncers in the digital world, they are:
- Instant bounce: these are users who land on your website and leave within a few seconds.
- Long bounce: these are users who land on your website and spent a considerable amount of time (40 seconds or more) before leaving.
The instant bouncer is bad for business, as if you receive too many of them over a prolonged period of time, Google is likely to use this as an indicator of poor quality content, which could lead to lower search rankings. Users who visit and leave your website immediately sends Google a signal that your website isn’t valuable to searchers.
A long bounce isn’t necessarily a bad thing, if your page provides the searcher with the answer they were seeking, they will have little reason to carry on staying on your website.
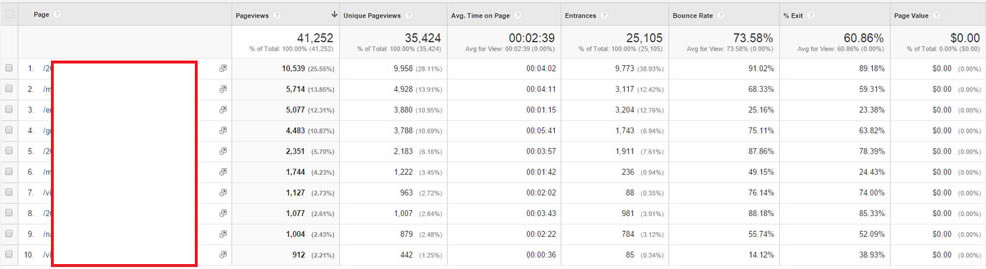
How to improve your bounce rate: locate pages that have the highest bounce rate and start diagnosing the problem. Pages may not be optimised correctly, you may not have any internal links allowing users to visit other parts of your website, no call-to-actions or you may just find your content doesn’t give your audience enough value.
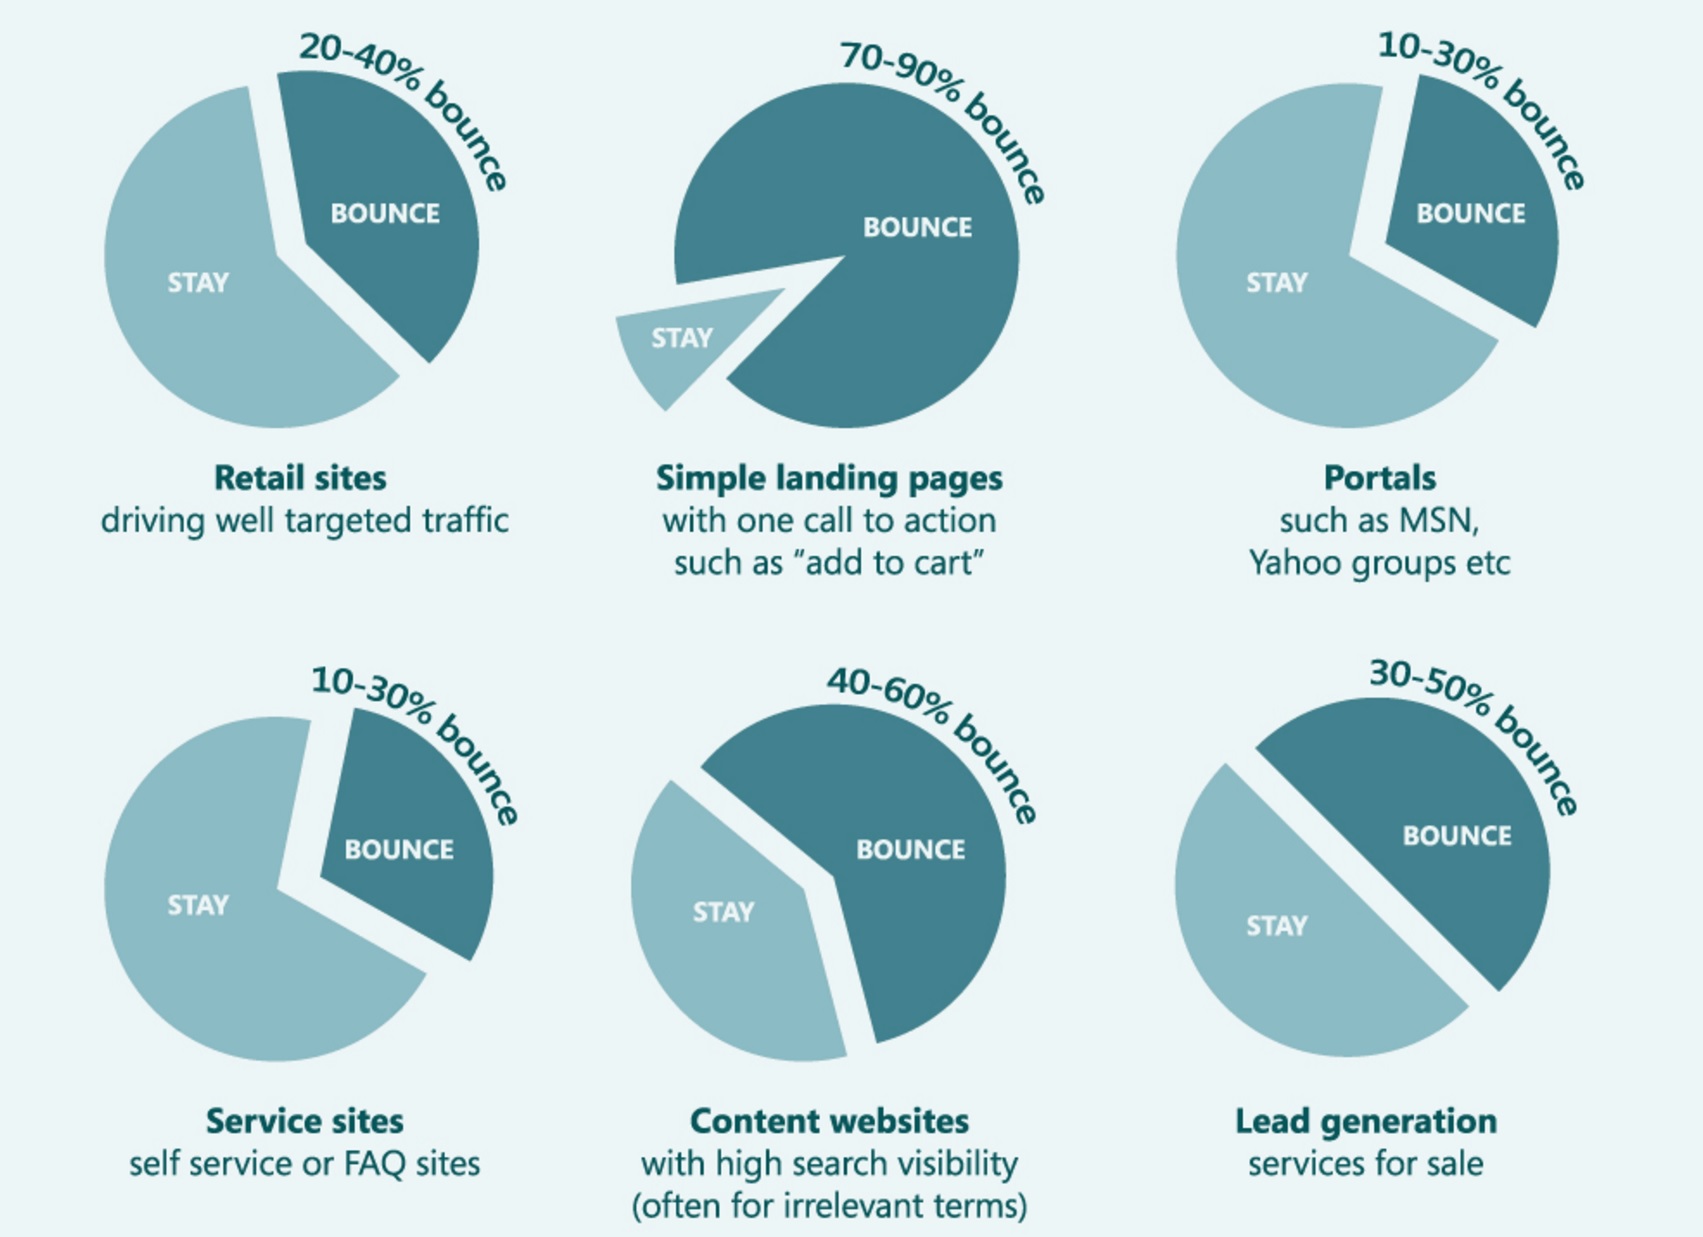
Here’s some estimates of what your bounce rate should look like for various page types:
2. Average time on page
As the name would suggest, average time on page tracks how long the average visitor spends on each page on your website as a whole. Usually the longer the better as it shows the user is engaging with the content on your website and increases the likelihood of the user taking the desired action on your website (lead, sale, signup).
How to improve average time on page: pull separate reports showing pages that receive a high average time on page (>60 seconds) with pages that receive a low average (<60 seconds) and look for common themes between both groups. Or rather than using “60 seconds” as your benchmark use your site wide average time on page as the benchmark and look at those pages that are below and above average.
For example, you may find that blog posts that are 2,000 words result in users spending more time on your website than 300-500 word articles. If you sell products, you may realise that traffic spends more time on product pages that contain longer descriptions, several pictures and customer reviews than product pages with less text, images and reviews. Remember to consider that a low average time on page may be due to less time being required to digest and take action on the content, for example if the average time spent on one of your landing pages is only 10 seconds but 10% of those visiting are submitting their details as a lead then happy days!
Once you learn what makes users stay on your site longer, you’ll be able to optimise lower performing pages and use the top performers as a framework for future pages.
3. User flow
User flow reveals the steps visitors take through your website. This is extremely useful to know as it allows you to intercept them at various pages and lead them into your sales funnel.
You can segment user flow by a number of metrics, some of the most useful are traffic source, landing pages and device:
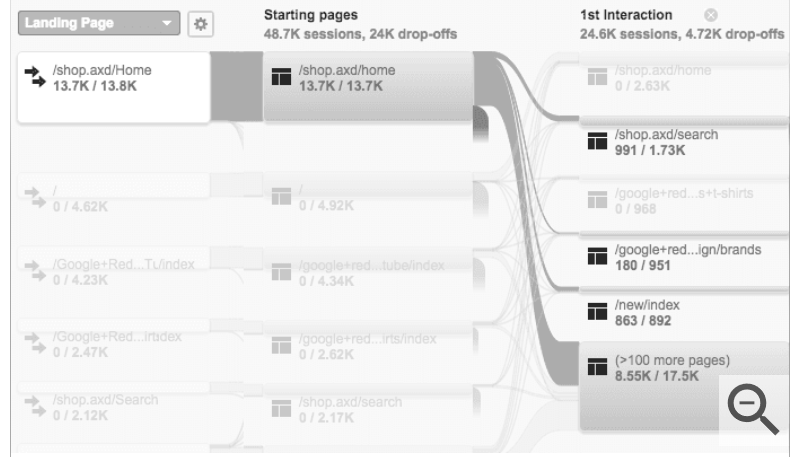
How to improve user flow: if you find that users are not visiting your landing page or product categories as much as you’d like, consider placing call-to-actions on pages they do visit enticing them to your target pages.
4. Exit pages
An exit page is the last page a visitor viewed on your website before leaving. This is an incredibly useful metric to monitor as you’ll be able to patch up websites leaks that are costing you revenue.
How to improve exit pages: a common symptom for high exit pages is a lack of call-to-actions. Does your highest exit page instruct visitors on what action they should take next, is it clear? How good is the content on that page, does it need to be updated?
Some of the questions you should be thinking about: Is the layout too confusing or do elements on that page take too long to load, is your website mobile-friendly? Always think about mobiles, some of our clients are seeing more than half of their organic traffic coming from mobile devices.
It’s often safe to ignore exit rates on order confirmation and thank you pages, as people don’t have much reason to stay on your site after making the intended action. Although depending on your business you may want to try and leverage this traffic to take the user on a “secondary” journey, the viability of doing this successfully will vary from site to site. Moonpig.com are one retailer who do this to great effect after you purchase a greeting card they give the customer the option of saving a reminder for the event (e.g. Birthday) next year.
5. Conversion goals & eCommerce tracking
Measuring your goals (lead, sale, signup, etc.) is critical to managing any online marketing strategy. It reveals which pages are converting, which traffic sources are offering a good ROI and reveals the online path prospects take to become customers.
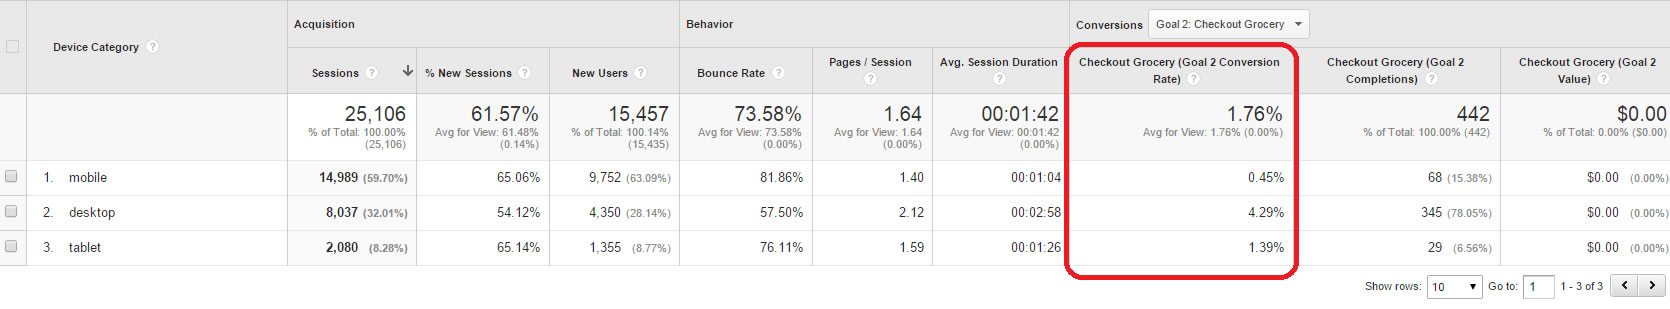
How to improve conversion goals: investigate which traffic sources and devices yield the most conversions. In the screen shot above, less than 0.45% of all mobile users end up making an online grocery order, compared to 4.29% of desktops users.
Knowing this information, the business in question may decide to focus ads on desktop users as they’ll receive a much better ROI on their ad spend. Although this insight may also raise questions like whether the site is sufficiently optimised for mobile users? Or does a mobile user hit the site for information but complete their purchase in a bricks and mortar store? Or does a mobile user come back later using their desktop to complete a more involved purchase?
Viewing goal completions by traffic source will reveal your most successful online channels. In the grab below we can see for this retailer that organic, social and email have the best conversions with paid search and display advertising performing the worst:
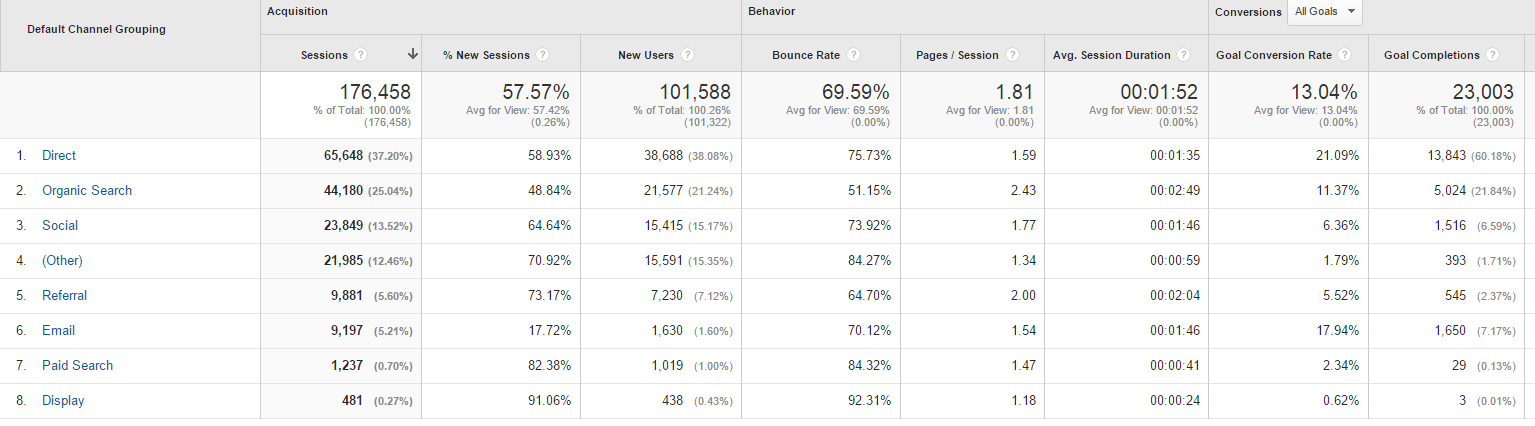
If the business above only had $200 in marketing to spend each month, that money would be best spent on search engine optimisation (SEO) and link building compared with paid search ads. By creating and measuring your goals, you’ll know which platforms to scale and which to drop.
Traffic from different sources can skew your metrics
The 5 metrics we’ve talked about here can be greatly skewed if your website starts to receive traffic from new traffic sources, for example when you turn on a new paid marketing campaign. If you drive most of your traffic using paid search or social media ads but fail to target the right audience, your metrics will be all over the place.
Put yourself in the users shoes, if you land on a website that doesn’t interest you, what do you do? Leave.
A common mistake with paid advertising is to quickly assume that it’s not working without considering the reason you’re getting a 98% bounce rate or a 4 second average time on page may not be because your website is poorly designed, but possibly as a result of driving the wrong audience to your website.
Summary
With dozens of platforms to advertise your business, 101 things to optimise on your website and thousands of keywords to target, if you don’t have solid data on how your business is performing, it will be very hard to make good business decisions.
This lack of primary data often results in spending money on platforms you shouldn’t, wasting time on creating content and setting up sales funnels that just won’t convert.
If you currently make your online marketing decisions without using data from Google Analytics, change this today. If you haven’t got Google Analytics set up on your website get it set up quickly – most modern content management systems have easy to use plugins that can make this process really quick and painless. If you have got Google Analytics sucking up data from your website, today’s the day to start ploughing through some of these reports!